
Back to home
Home / Dashboards & Reports
Sample dashboards
Dashboards and reports, built around your needs
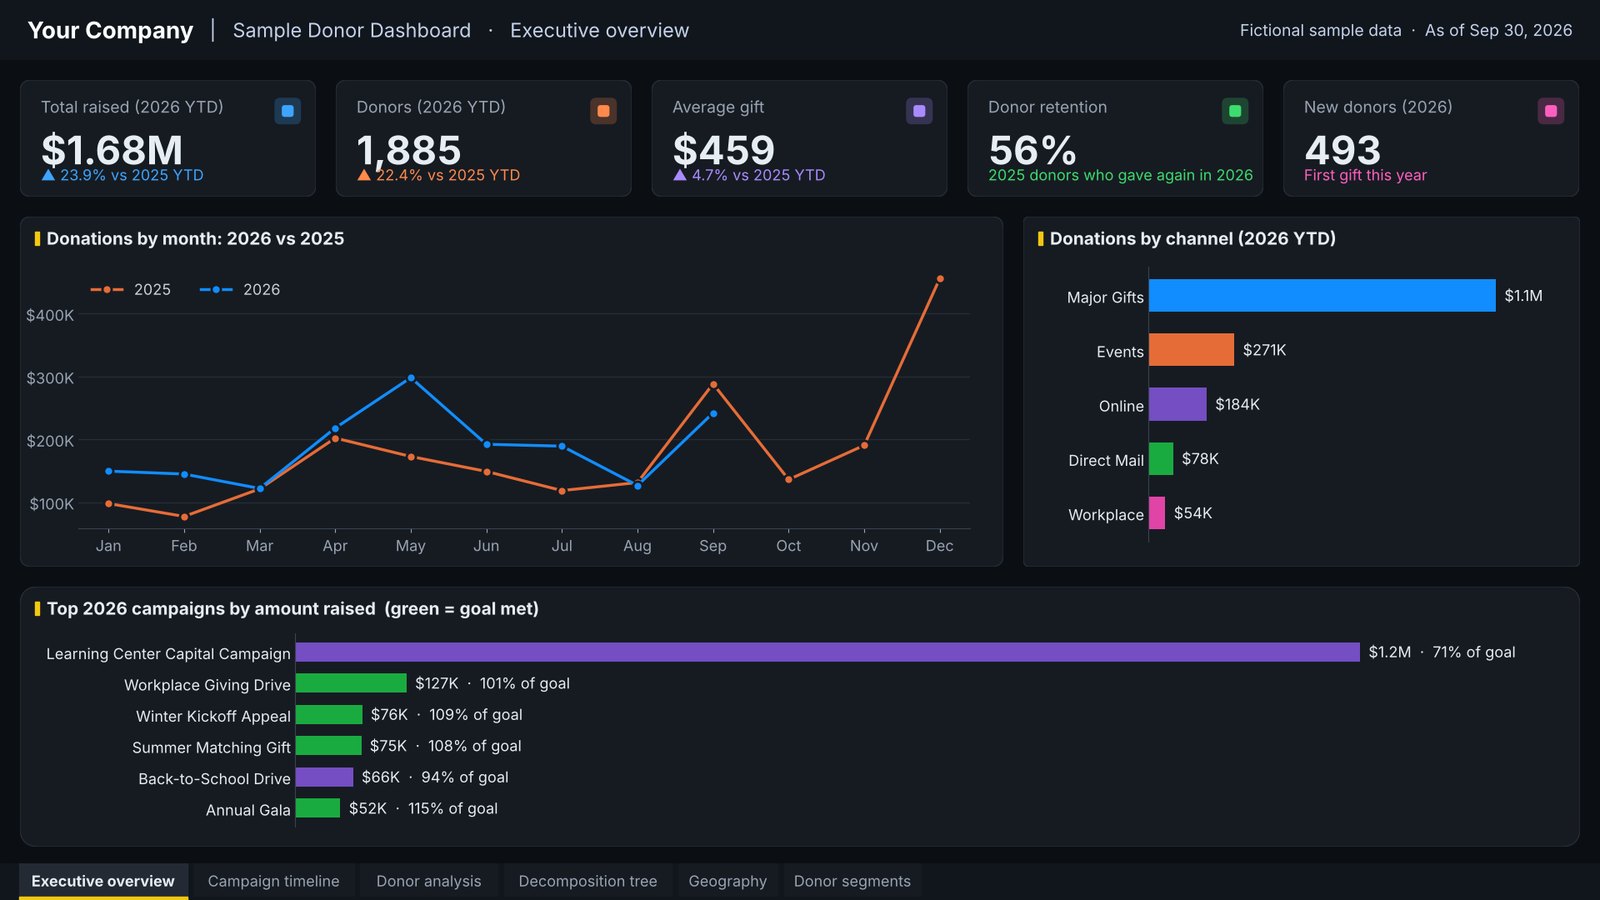
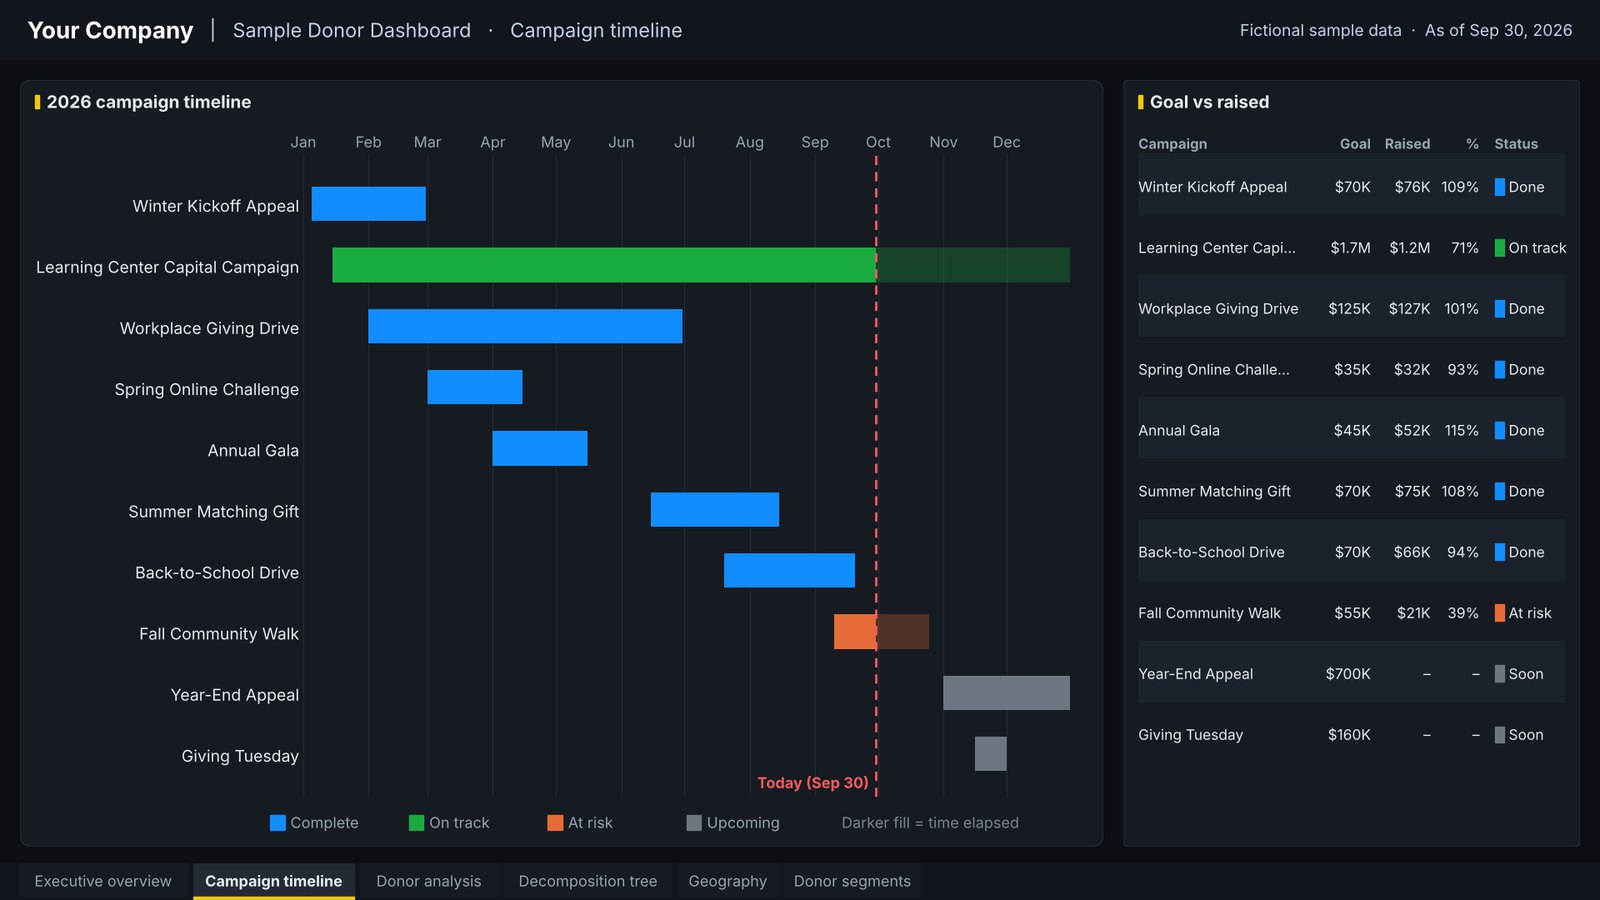
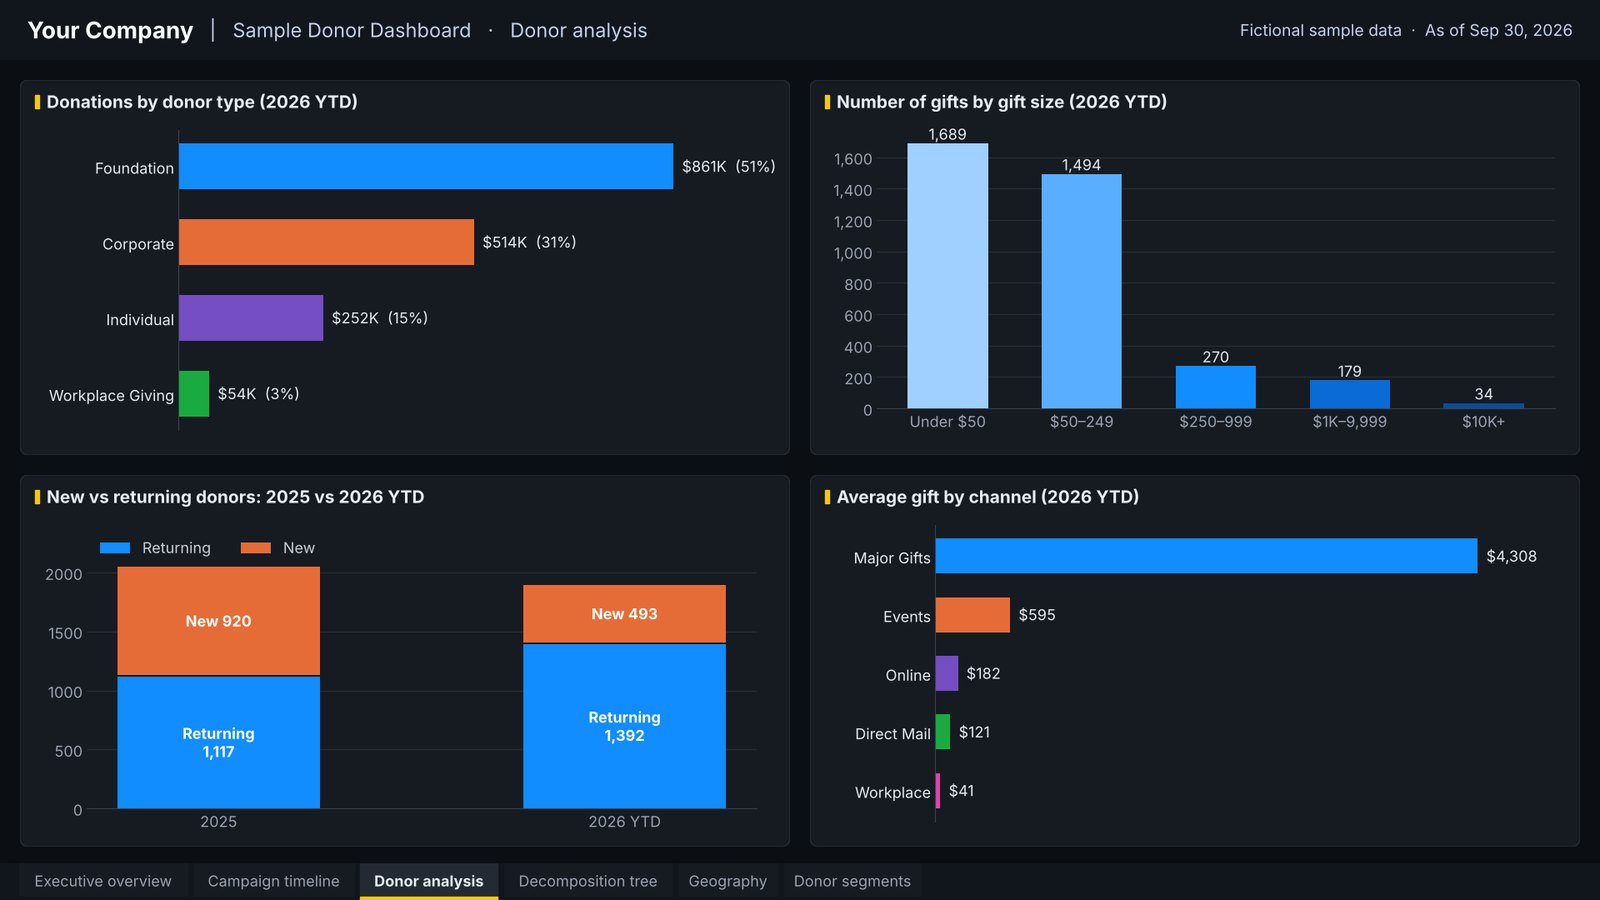
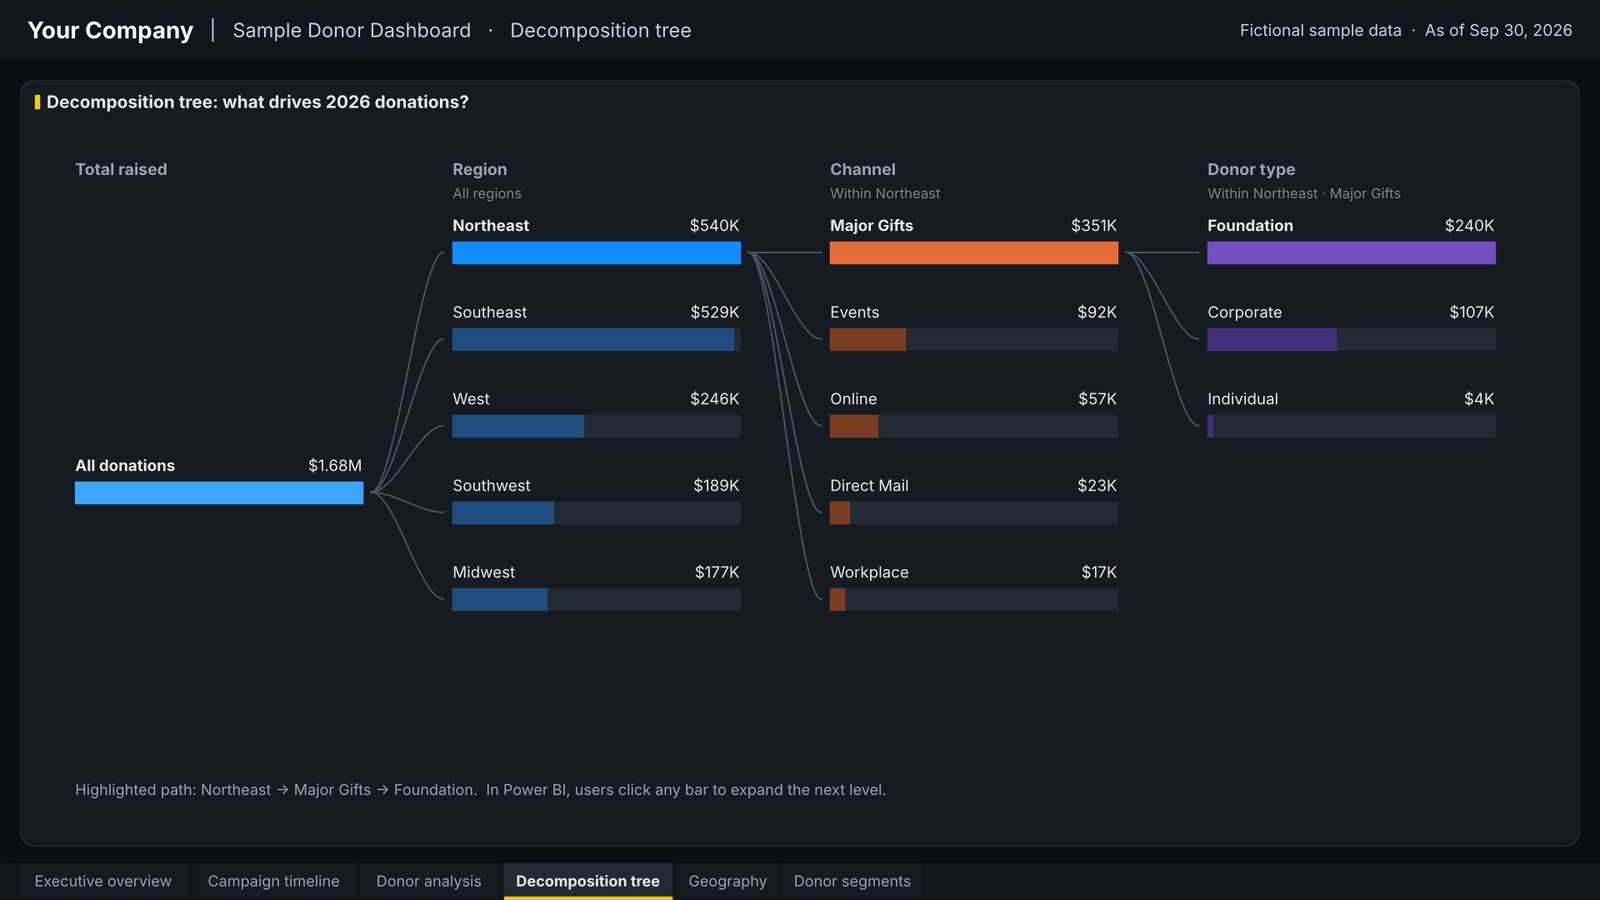
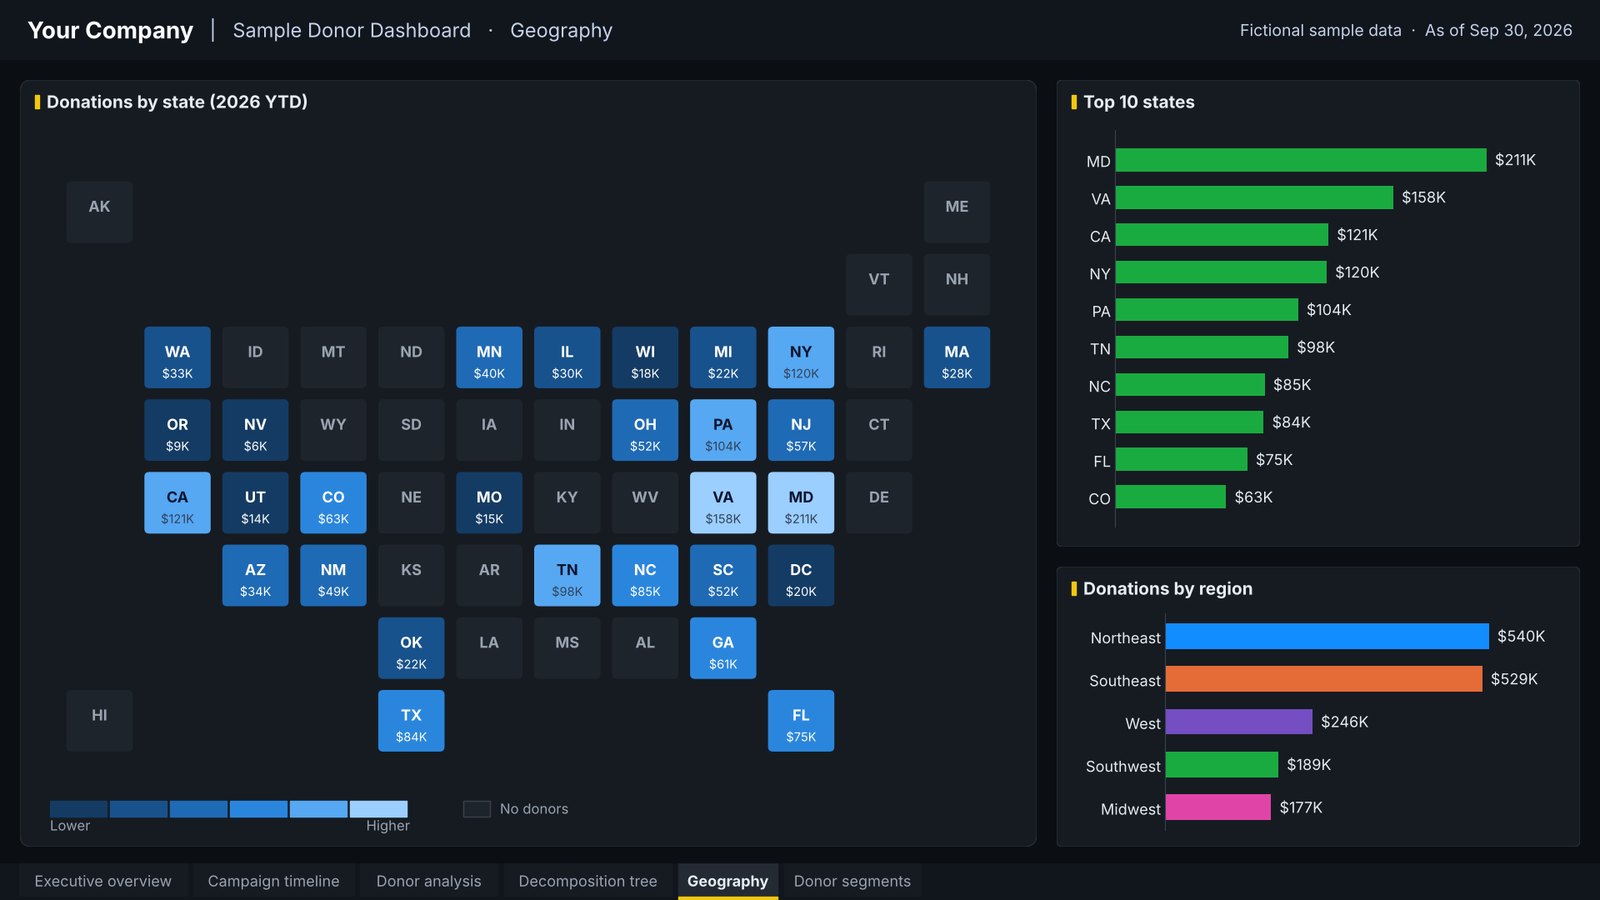
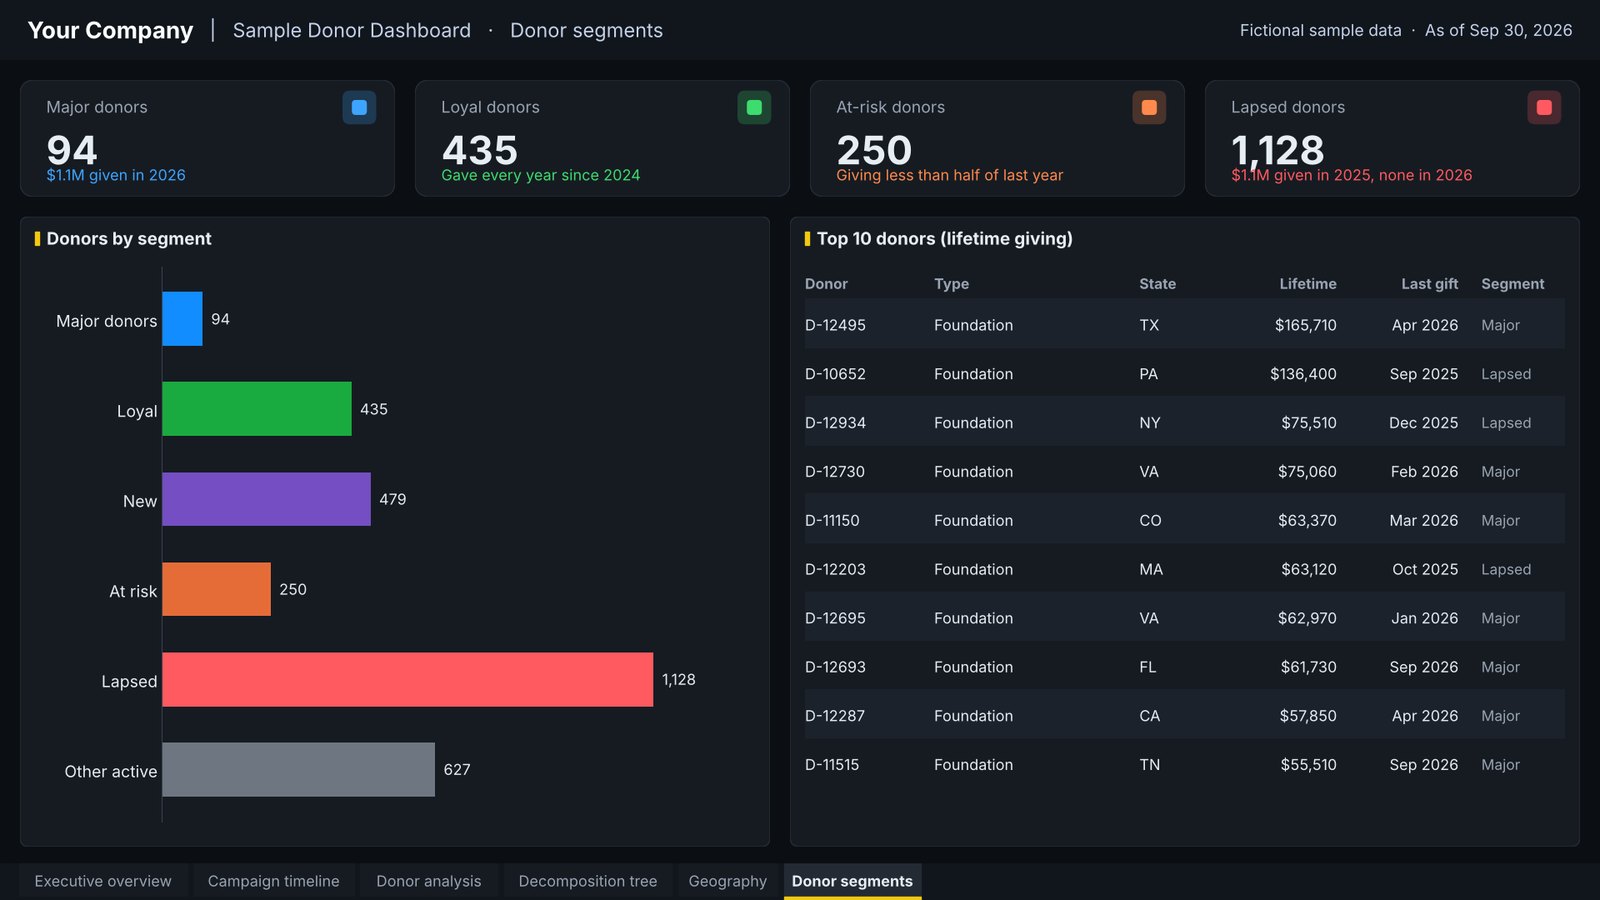
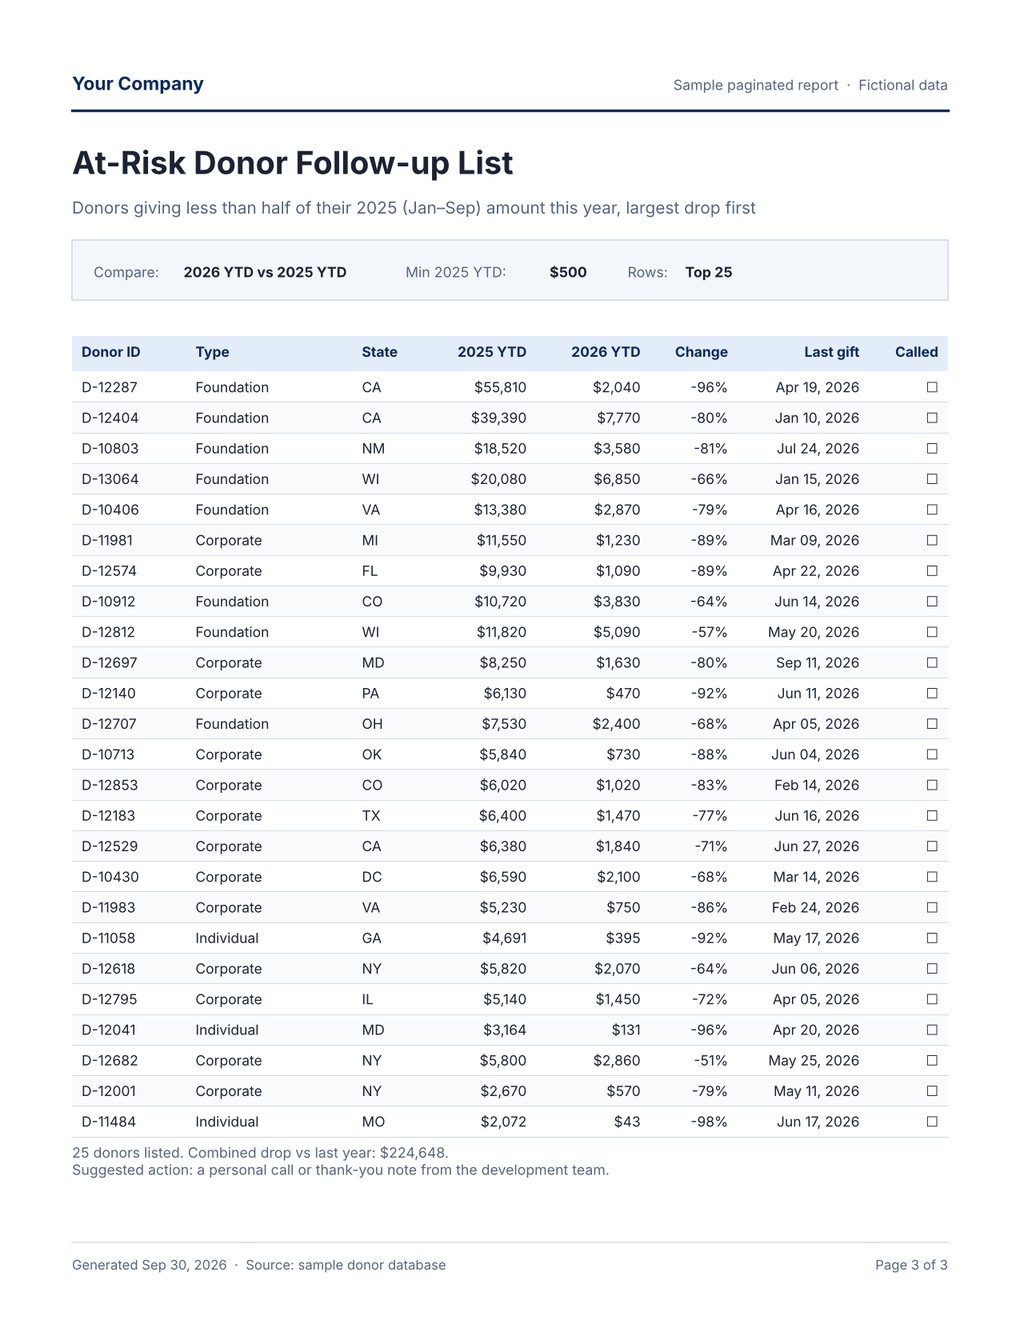
We build Power BI dashboards and paginated reports based on your requirements. Here is a sample for a nonprofit, using fictional donor data. Click any page to see it full size.
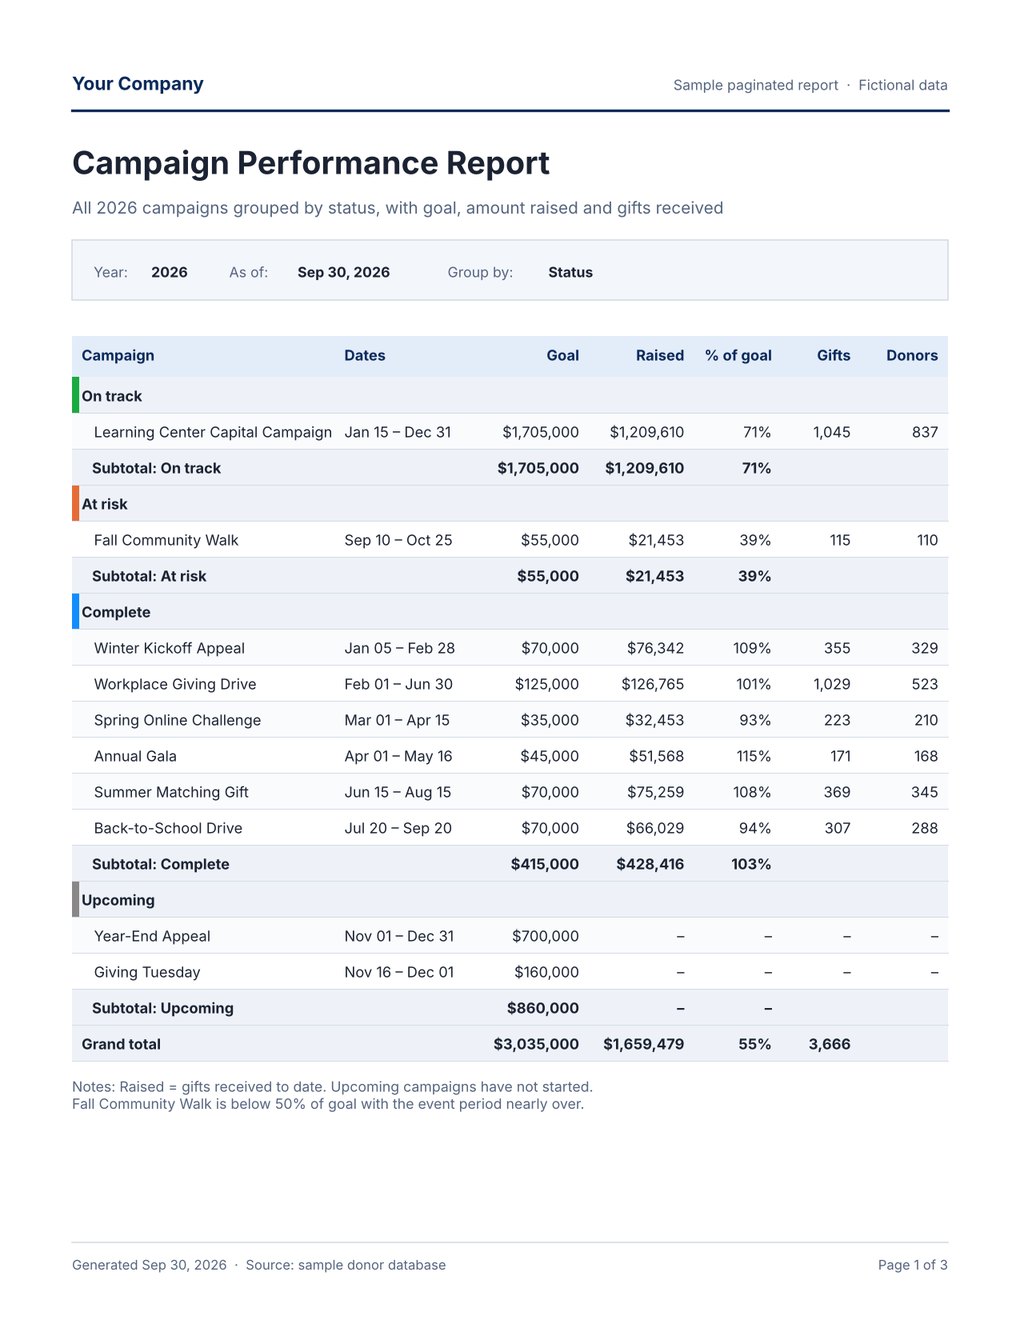
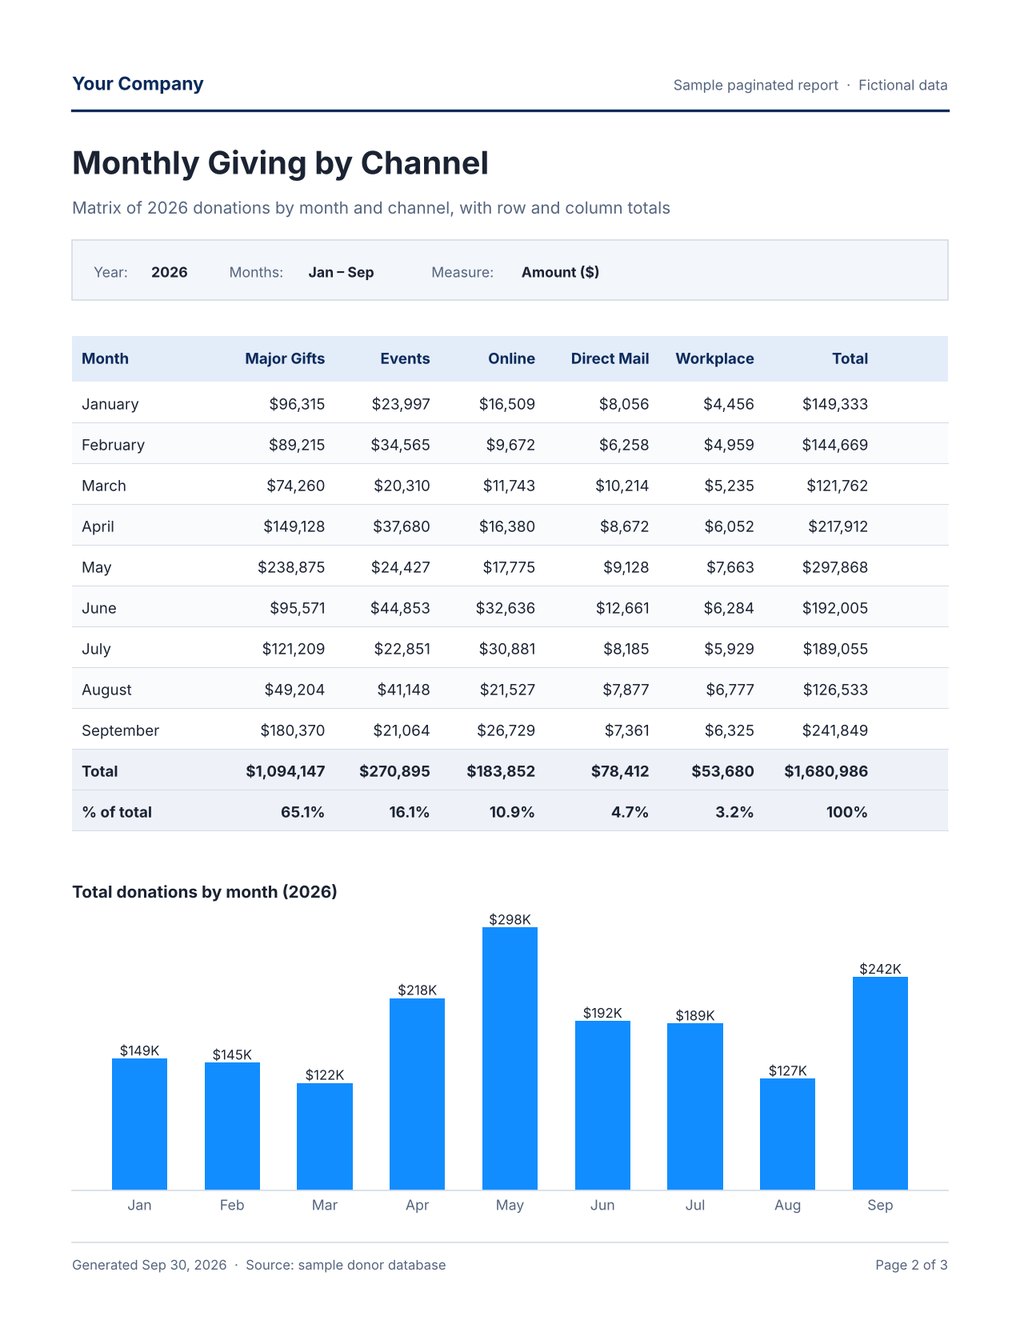
Paginated reports
Print-ready reports for board packets, finance and staff, scheduled and emailed as PDF or Excel. Built with Power BI Report Builder.
Download sample deck (PowerPoint)
Download sample reports (PDF)
Get a dashboard like this
All names and numbers are fictional.
Let's solve your problem together
Book a consultation with Amir to talk through your goals. No obligation.